jeedom-powerwall-plugin
1.0.0 (2023-02-10)
![]()
This is the very first **stable version published on Jeedom market**
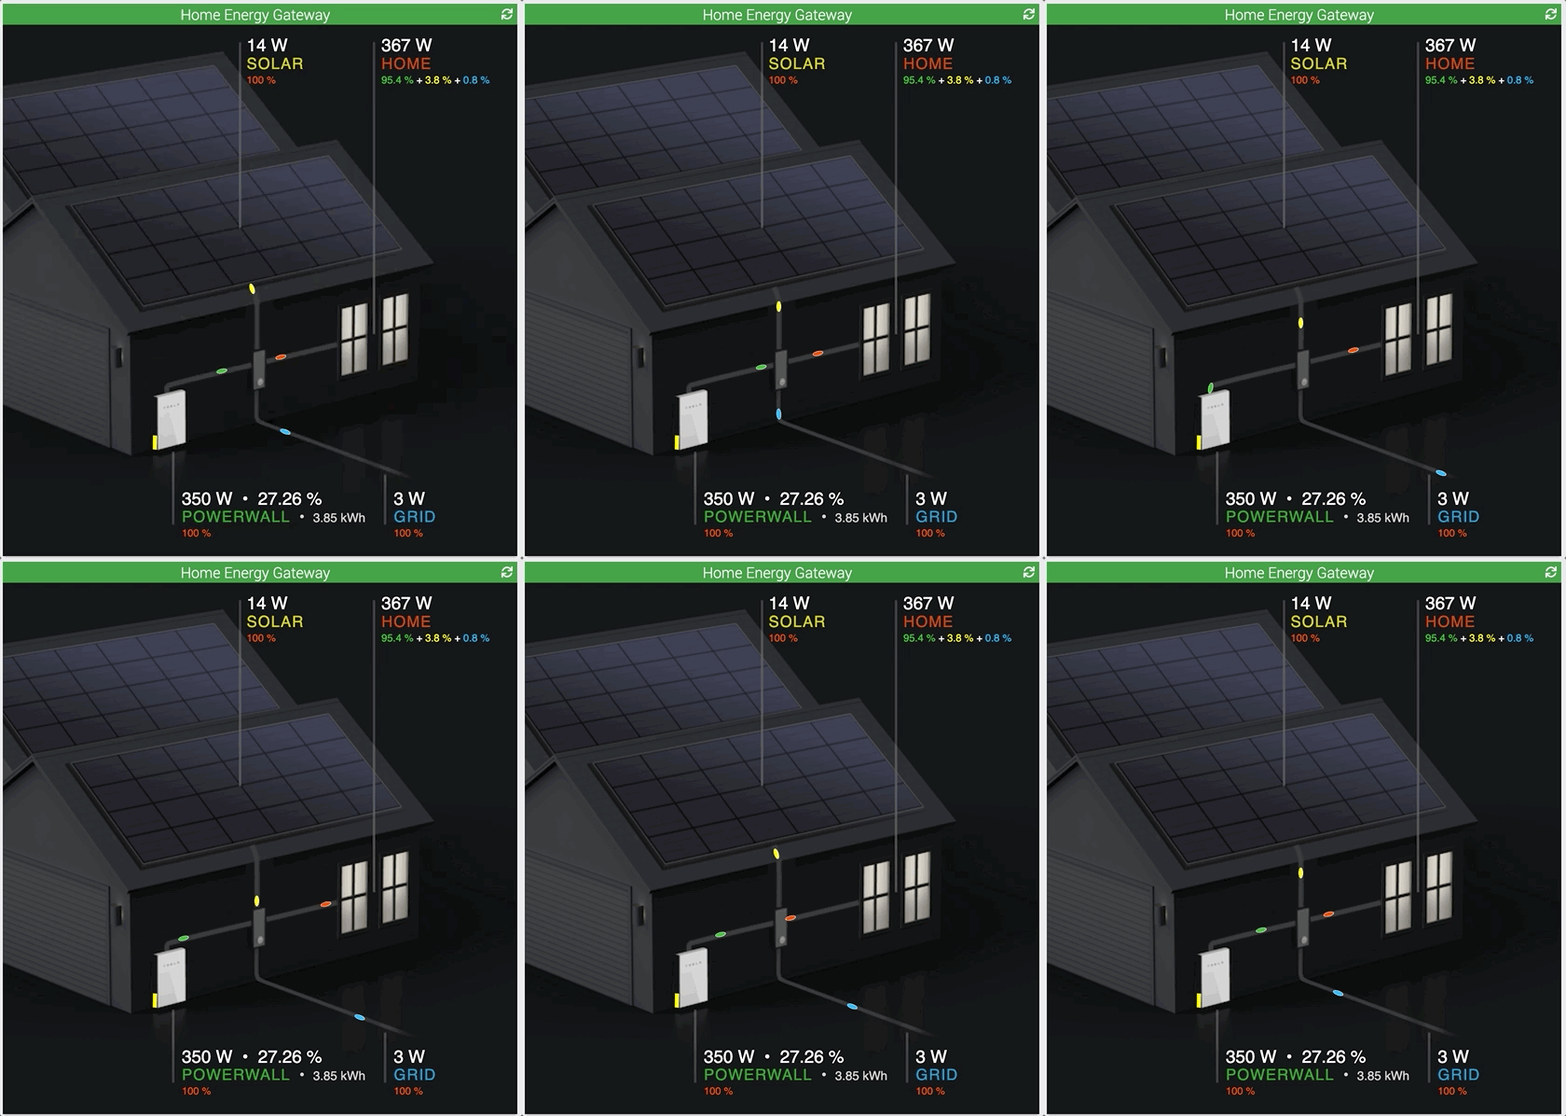
- HOME: Display power consumed by your appliances
- SOLAR: Display solar energy
- GRID: Display the energy your system sell or buy
- POWERWALL: Display the stored energy
- An “image” mode provides a synthetic view of the exchanges between the different elements
- The battery level is displayed on the left side of the Powerwalll:
- red when battery is 20% charged or less
- yellow when battery is in 20%-40% range
- green when battery is 40% charged or above
- Animated dots indicates the flow directions (charge/discharge et buy/sell)
- Percentages on each elements indicates where energy comes from or goes to :
- As an example, on solar side, the widget shows percentage of energy that is used by appliances and the one that goes inside Powerwall.
- On House side, the widget shows where energy comes from: SOLAR, POWERWALL and GRID
- The data from all the sources can be fetched as Info from equipment and be part of Jeedom scenarios.
- User can choose a data acquisition every 5 or 30 minutes (cron5 et cron30)

Note
A big thank you to
Florent, the first tester and user. Thank you for your trust.